Slow progress but COVID cases fall around Charlotte. Here’s the latest ZIP code info.
The spread of COVID-19 has slowed recently in and around Charlotte, though the caseload and hospitalizations remain at some of the highest levels seen in the pandemic.
Between Jan. 14-27, Mecklenburg County officials say the 14-day case rate was 905.7 infections for every 100,000 residents. By comparison, the rate was 1,069 between Dec. 31-Jan. 13 and 831.3 between Dec. 14-27.
It’s unclear how mutant strains of the virus, including the UK variant detected in Mecklenburg less than two weeks ago, could prompt another surge of coronavirus cases.
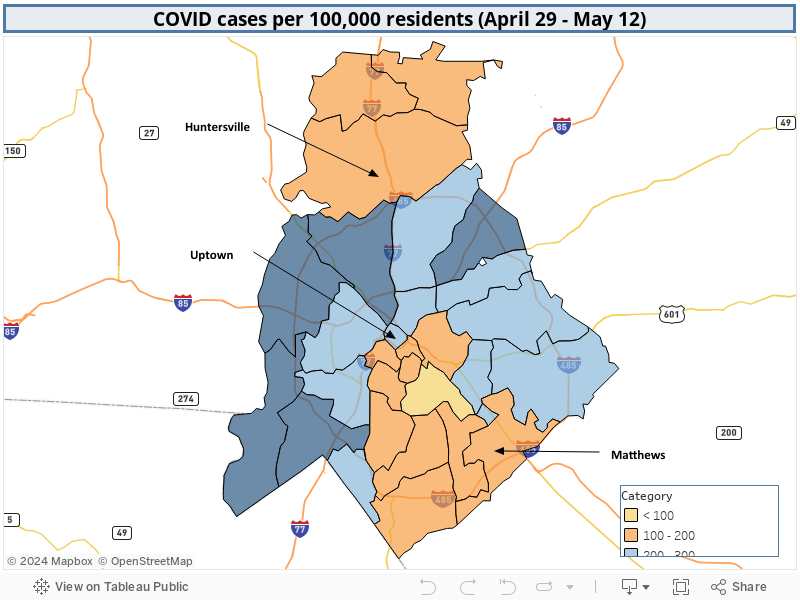
The new map of case rates by ZIP code shows recent infections concentrated in and around uptown; near Pineville; in neighborhoods along North Graham, North Tryon and North Davidson streets; and most of west Charlotte.
Mecklenburg Public Health Director Gibbie Harris has said residents must stay vigilant and follow COVID-19 safeguards — such as wearing masks, social distancing and refraining from in-person gatherings — to avoid upending the modest progress seen after the post-holiday spike.
In the second half of January, the county recorded nearly 10,000 new cases. Yet the latest geographic breakdown of coronavirus infections continues to underscore certain parts of Mecklenburg County are disproportionately impacted.
Based on the most recent data (roughly the second half of January), only five ZIP codes across the county posted case rates below 800 infections for every 100,000 residents. Another five ZIP codes notched rates above 1,200.
Lower rates indicate less prevalence of the virus, yet people are still at risk of being exposed to COVID-19 whenever they leave their homes, officials warn. Mecklenburg’s data shows where infected residents live — not necessarily where they contracted the virus, such as at essential front-line jobs elsewhere in the Charlotte region.
Since the start of the pandemic, Mecklenburg has logged 86,860 cumulative cases, the North Carolina Department of Health and Human Services reported Monday. County officials say 777 residents have died of coronavirus-related complications.
The seven-day average of new cases rose sharply in mid-December, peaked in mid-January and has been slowly falling since.
COVID-19 case rates by ZIP code
This data comes from Mecklenburg County Public Health and includes positive COVID-19 test results, based on a person’s home ZIP code, between Jan. 14 and 27.
Below 800 cases per 100,000 residents
- 28036: 580.1
- 28270: 636.2
- 28277: 735.3
- 28031: 763.4
- 28210: 774.6
Between 801-900 cases per 100,000
- 28211: 803.0
- 28269: 803.4
- 28078: 808.6
- 28105: 817.6
- 28226: 819.2
- 28217: 823.7
- 28262: 860.6
- 28205: 865.9
- 28207: 866.5
- 28209: 885.6
Between 901-1,200 cases per 100,000
- 28273: 932.2
- 28213: 972.1
- 28227: 985.7
- 28278: 995.3
- 28215: 1,029.4
- 28212: 1,033.5
- 28216: 1,052.6
- 28214: 1,133.9
- 28202: 1,198.9
Above 1,201 cases per 100,000
- 28208: 1,220.9
- 28204: 1,265.4
- 28203: 1,275.0
- 28134: 1,276.0
- 28206: 1,660.6
Gavin Off contributed to this report.