Gerrymandered or no? How will courts judge new North Carolina political maps?
READ MORE
Maps Under the Microscope
At least once a decade, state lawmakers rebuild North Carolina’s election maps. This process of redistricting carries a set of rules. But those rules – and how well mapmakers follow them – get intense scrutiny from the courts almost as soon as the maps become law. This is The N&O’s special report: “Political Maps under the Microscope.”
Expand All
Gerrymandered or no? How will courts judge new North Carolina political maps?

A guide to the three gerrymandering lawsuits challenging NC’s political maps
Meet the judges who could soon rule on North Carolina’s redistricting lawsuits
Podcast: Explore North Carolina’s long history of gerrymandering election maps
Want to design NC redistricting maps? Here’s an app to draw your own political lines.
Picture – for just a minute – the sky on a clear night, and all the stars you can see.
Then beyond that, what we can’t see: All the suns too far away for our eyes to detect.
That number is vast. But that’s nothing.
State lawmakers at least once every 10 years deal with a much more colossal figure: The number of ways they can combine all the bits and pieces of North Carolina together to form an electoral map. That’s redistricting, a process they undertake to draw new lines for the U.S. House, state House and state Senate.
There are more of those combinations than planets in our galaxy. More, in fact, than atoms in the universe.
The legislature’s Republican majority faced all that choice as they crafted and passed new maps in early November. They used a set of rules – some they made for themselves, others hammered out over decades of court decisions.
But those rules – and how well mapmakers followed them – have become the target of intense scrutiny as the process moved from the legislature to the courts almost as soon as the maps became law. Multiple lawsuits have already been filed to force lawmakers back to the literal drawing board.
To understand what’s next, we’ll need to examine a few basic building blocks of redistricting, its unique history in North Carolina and the emerging science of gerrymandering detection.
Here’s what you need to know, pulled straight from our special Under the Dome Under the Dome podcast, Monster: Math, maps and power in North Carolina, about how maps are drawn.

Lawmakers must follow the rules – mostly
The enormous power the U.S. Constitution grants state legislatures to draw maps is constrained – at least somewhat – by a set of rules called redistricting criteria.
These criteria mostly originated in state and federal courts, so a map that works is a map that passes legal muster.
Some of those rules are a bit obvious.
Districts have to be connected, or contiguous. There are some exceptions for islands or other geography. But in general, districts should be in one piece.
They also have to be equal in population.
This may seem foundational to our democracy: The idea of one person, one vote. But that concept, and the Supreme Court cases that enshrined it, only date back to the middle of the 20th century.
Until then, legislatures sometimes would just skip redistricting. As populations shifted, the number of people living in each district got more out of whack.
A series of Supreme Court cases in the 1960s put a stop to that.
Redistricting today means redrawing political lines all the way down to city council and school board races. In North Carolina, it’s the legislature’s job to craft maps for Congress as well as the state’s own House and Senate.
And one of the immutable rules of that process is equal population.
On the congressional level, that means almost exactly equal.
“They draw the maps so that the population deviation is at an absolute minimum. For the state House and state Senate, however, there is more wiggle room,” said Blake Esselstyn, a consultant who works with city and county governments to help draw district lines for local races.
There’s a preference in North Carolina not to split counties. For legislative seats, that’s actually part of the state constitution. But the equal population requirement means that’s not always possible.
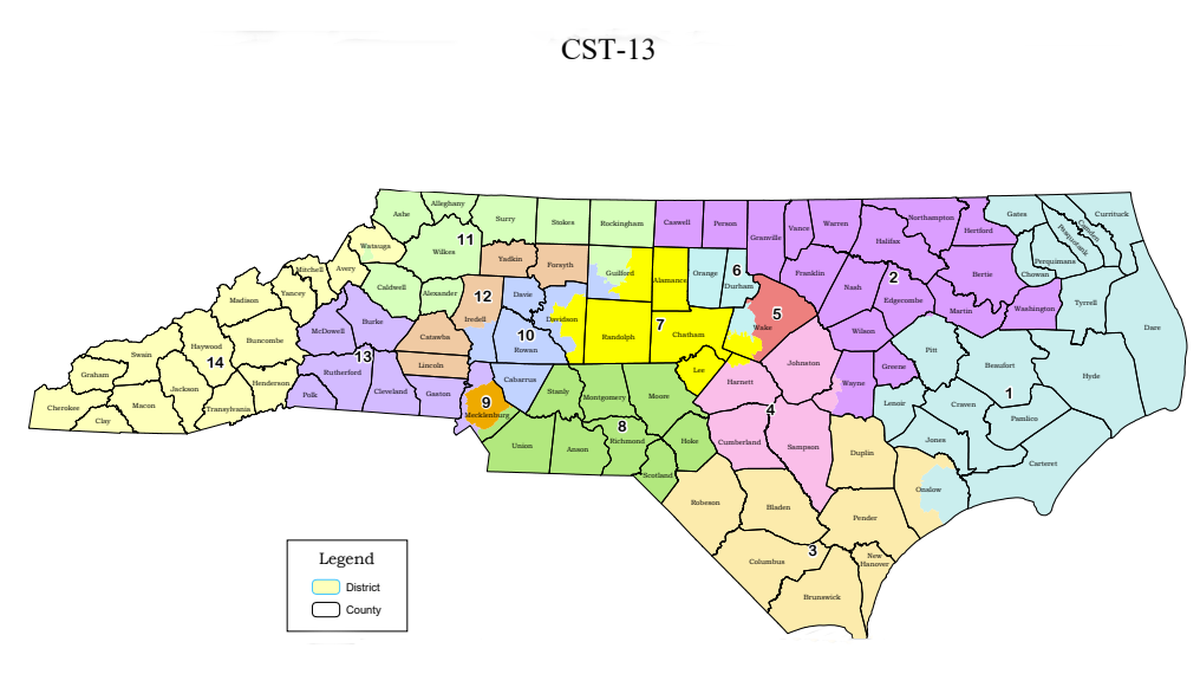
Consider our congressional delegation. North Carolina this decade will have 14 U.S. House seats.
Our population is about 10.4 million. Divide that by 14 districts and you’ve got about 746,000 people in each.
But Wake and Mecklenburg are each home to 1.1 million people. They’ve got to be split, and less populated counties have to be combined.
To help guide how they divvy up those lines, mapmakers sometimes consider “communities of interest.”
It’s a little more nebulous than the equal-population rule. But the concept makes sense: if you believe politicians are elected to represent communities, rather than random clusters of land, you might want to avoid breaking up those communities wherever possible.
A community of interest could be a region with unique needs, like the Outer Banks, or land that’s largely agricultural. Or it could be established neighborhoods within a town.
“You could say, let’s not split these neighborhoods, and that would be considered a community of interest that’s relatively easy to map,” Esselstyn said.
Contiguity. Equal Population. County and city boundaries. Communities of Interest. Those are just four of the traditional redistricting criteria.
But they’re not the only factors likely to come up in court.

Jim Crow battles echo today
A little over a half-century ago, President Lyndon B. Johnson took the podium at the U.S. Capitol and signed into law a measure long awaited by civil rights advocates.
He called it a triumph of freedom.
“This act flows from a clear and simple wrong. Its only purpose is to right that wrong. Millions of Americans are denied the right to vote because of their color. This law will ensure them the right to vote,” Johnson said. “The wrong is one which no American, in his heart, can justify. The right is one which no American, true to our principles, can deny.”
The Voting Rights Act promised to do away with decades of poll taxes, literacy tests and other Jim Crow laws – laws Southern Democrats started creating around the turn of the 20th century to block Black citizens from voting.
But Democratic lawmakers in power had other levers to pull to check growing Black voting power. They could just redraw the maps.
“The redistricting process focused on keeping African Americans out of the electoral process,” said Irving Joyner, an N.C. Central University law professor and long-time civil rights activist. “And it was across the board, whether we’re talking about Congress, or we’re talking about the state House, the state Senate or even local races.”
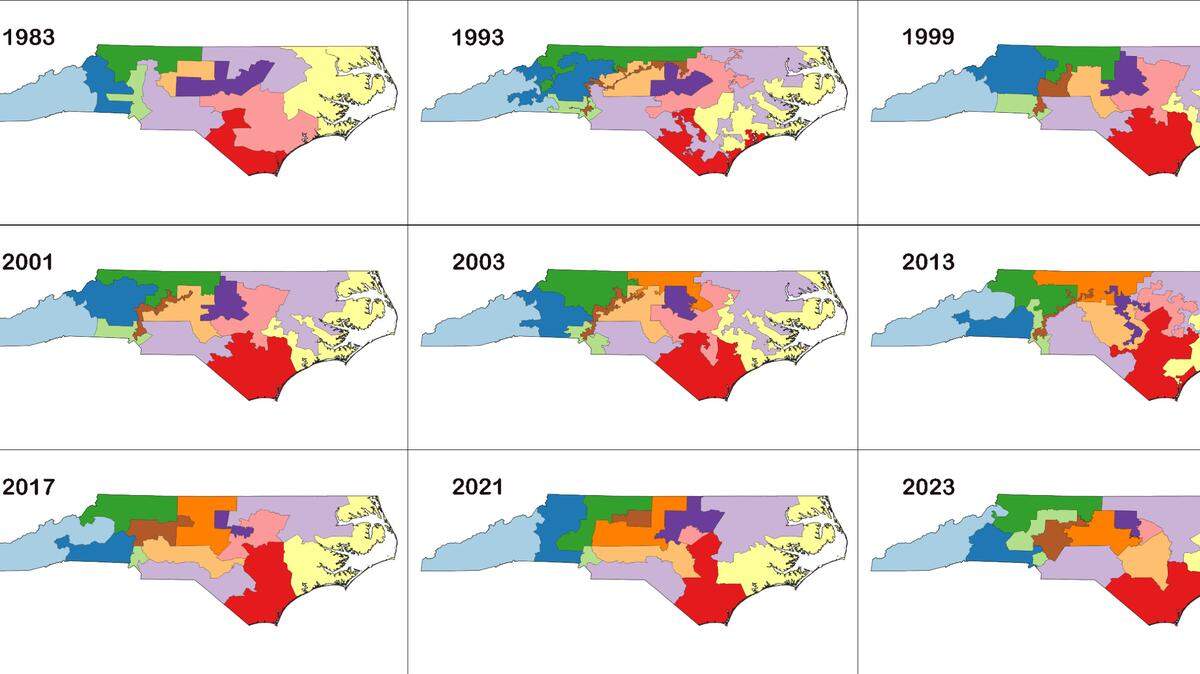
In the mid-1980s, a group of Black North Carolina voters challenged some of those maps. And they cited the Voting Rights Act when they argued that districts were created specifically to deny Black voters the choice of candidates.
The Supreme Court agreed.
What resulted was the Gingles test, named for the Supreme Court case that established it. The ruling underscored exactly how the VRA impacted mapmaking where voting was racially polarized.
“The general principle of the Federal Voting Rights Act of 1965 is that minority populations should be given an opportunity to elect representatives of their choice if certain conditions are met,” Blake Esselstyn, the North Carolina-based redistricting consultant, said. “Those certain conditions have to do with having a sufficiently large and sufficiently concentrated population that tends to vote in a similar manner.”
The result was voting rights districts, lines specifically drawn to empower minority voters.
That often meant Black voters, specifically. But the country’s changing demographics and voting habits are making things more complicated.
“There are more racial groups than there used to be. And the Voting Rights Act was written at a time when it was... to be frank, it was more black and white,” Esselstyn said.
A lot more has changed since then. The U.S Department of Justice can no longer unilaterally block district maps if they fail to protect minority groups. “Preclearance” – as it’s called – stopped after a 2013 Supreme Court decision effectively gutted that section of the VRA.
And lately, it’s been Republicans whose maps have been overturned by courts for diluting Black voting power.
Similar claims are at the center of lawsuits against maps drawn in 2021, meaning the Voting Rights Act still has power over the process.

Can mapmakers ignore race?
When state lawmakers set last year’s redistricting criteria, they included traditional rules like equal population and contiguity.
They also banned racial data.
That’s something of a tightrope walk.
Preclearance, the U.S. Department of Justice’s process for vetting maps for signs of racial discrimination, ended in 2013. But mapmakers must still comply with the broader Voting Rights Act.
That means providing minority groups the opportunity to vote for candidates of their choice – under certain conditions. Here’s where the Gingles test, established by a mid-1980s Supreme Court case, comes in.
One of the elements of that test is racially polarized voting. If there’s evidence that blocs of majority and minority voters are politically at odds, mapmakers need to take steps to boost the influence of that racial minority group.
Some Republican leaders, like Sen. Paul Newton, say those conditions no longer exist.
“We are going to comply with the Voting Rights Act. But recent legal opinions have told us there is no racially polarized voting in North Carolina,” Newton said.
Those legal opinions? They’re some of the same cases Republicans lost after last decade’s redistricting cycle.
Allison Riggs, one of the central attorneys in those previous lawsuits against the state over gerrymandered maps, says these GOP claims don’t hold up.
“I’ve heard already in debates or in committee meetings, legislators saying, ‘Well, we don’t have racially polarized voting. That’s what the racial gerrymandering cases said,’” Riggs said. “No, that’s not what they say. You’re being purposely obtuse, I think.”
Racially polarized voting is somewhat technical. It’s a legal standard.
In 2011, Republicans commissioned a 24-page study that examined the issue, finding that polarization did exist in at least half of all North Carolina counties.
But there was no study this time around. Without one, Riggs said it was impossible to know whether the shifting population of Black or Hispanic voters needed new opportunity districts, making the latest maps’ compliance with the VRA unlikely.
“Racially polarized voting patterns can change fairly rapidly. And I think we are seeing some pretty strong evidence that in the last five years, in parts of particularly rural and some suburban parts of the state, that we are seeing an increase in racially polarized voting,” Riggs said.
Republicans like Newton say they were worried using racial data at all would subject them to lawsuits on the grounds of racial gerrymandering.
“We have invited our Democrat colleagues or any colleague who thinks they have evidence otherwise, once the map is drawn, that it somehow violates the Voting Rights Act, to bring that to our attention,” Newton said.
The Democratically aligned N.C. League of Conservation Voters did just that in the fall, filing suit against the maps on the grounds they “egregiously (and intentionally) dilute the voting power of North Carolina’s Black citizens.”

You can measure ‘ugly’ with math
A lot of political maps can be pretty ugly.
They have tentacles that dip down into liberal or conservative enclaves. Limbs that stretch and wrap around neighborhoods of Black or white voters. Or sharp points that converge to break a city into splinters.
These monstrous shapes can signal two major traits of gerrymandering. Packing, where you consolidate voters into districts they’re certain to dominate. Or cracking, where you split them up and guarantee they’re an extreme minority.
Evidence of packing and cracking is often central to racial gerrymandering lawsuits. Does a map concentrate too many Black voters in a district? Or break them up to dilute their voting power? The questions are similar for partisan gerrymandering cases too – just substitute Democrats or Republicans.
But what’s the opposite of a monstrous district? Turns out that’s something you can measure.
It’s called compactness. And there are dozens of formulas you can use to evaluate just how janky a shape is.
Which formula is best isn’t all that clear, according to Michael Li, a lawyer with the New York-based Brennan Center for Justice, an advocacy group that’s active in the fight for fair maps.
“There’s still actually a fairly robust debate about whether some of those are the best measures,” Li said. “Some of the most standard ones that we use, it turns out that they’re standard just because they were included in redistricting software.”
For example, you can calculate a district’s compactness using the ratio of its area and its perimeter, squared. That’s a Polsby-Popper score, where a circle is the most compact shape possible.
You can wrap a theoretical rubber band around a shape and add up all the blank space the band doesn’t touch. That’s called convex hull.
Or maybe instead of a rubber band around a district, it’s a perfect circle, and the smaller the circle’s area, the more compact the shape.
Compactness is one of those traditional redistricting criteria a lot of mapmakers use to evaluate district lines. That includes North Carolina.
A compact district – theoretically – means a voter likely has an intuitive idea of the district they’re in. Representatives don’t have to make a 175-mile drive to get from one constituent to another.
But measuring the ugliness of a district isn’t the same as measuring how gerrymandered it is. Looks, Li said, can be deceiving.
“In some ways, it’s easier with data and technology now to draw nice looking districts that actually are wildly skewed in favor of one party or the other,” Li said.

Purple states don’t always yield purple maps
How do you measure “the will of the people?”
The challenge is to somehow weigh the wants and needs of an often polarized public in a way that will actually get things done fairly.
You could put everything to a vote. But direct democracy gets unwieldy for a country with a population of about 331 million.
You could choose people to vote on your behalf – representative democracy. As we choose, one party or another, our votes effectively determine the balance of power. If we’re split 50-50, so is the legislative body we elect.
That’s proportional representation, where the political makeup of an electorate roughly translates to the breakdown of seats.
That might sound familiar. And fair.
But it’s not our system.
Consider the statewide tally of votes for the U.S. House.
In recent North Carolina elections, the statewide vote counts hovered right around the 50% mark for Republicans and Democrats. That’s about as consistently purple as you can be.
Gerrymandering opponents will sometimes point to our partisan split – almost even right down the middle – and compare it to the actual results of our U.S. House elections.
“If you think proportionality should rule, then the congressional delegation after the 2022 election should conceivably be 7-7, seven Democrats, seven Republicans,” said Michael Bitzer, professor of political science at Catawba College and author of a textbook on redistricting in North Carolina.
But since the GOP took control of our state legislature and the mapmaking process in 2010, between 62 and 77% of our House delegation has been Republican.
This discrepancy – a deep red slate of representatives in a purple state – isn’t necessarily a sign of gerrymandering.
“The U.S. Supreme Court has said, ‘You are not required a certain percentage of the seats if you get a certain percentage of the votes.’ Now, if Congress wanted to make that a stipulation, make it a requirement, they could do so. But in the basic rules of the game, that is not a requirement,” Bitzer said.
That makes democracy in America a little different than, say, Germany. Germans do use proportional representation. The vote divides parliament into more than a half-dozen political parties. It’s a little more chaotic and uncertain. And it forces coalition-building to form a political majority.
American politics, though, are a little more dependable. Third parties aren’t much of a thing. And U.S House members get elected in a first-past-the-post system – winner take all.
“By the rules of the game in American politics, you’re tilting the winner’s advantage, because they get 100 percent. And the person who got 48, 49% of the vote gets zero,” Bitzer said.
In effect, every single vote above that 50% mark has no impact. Just like every vote cast for the loser.
Those “wasted votes” can add up to skew the partisan breakdown far and away from what we’d expect under a system of proportional representation.
We sort ourselves – that’s not helping
Since the 1990s, our once rural state has been majority urban: In terms of population, cities and their surrounding suburbs rule.
It’s a trend demographers like Rebecca Tippett have seen continue decade after decade in each census, the big count of every resident that triggers redistricting every 10 years.
“We’ve seen incredible concentration of the state’s population in our urban areas,” said Tippett, who runs Carolina Demography at UNC-Chapel Hill.
Overall, North Carolina added about 1 million people over the last decade. Despite that growth in places like Raleigh and Charlotte, half the state’s counties lost population between 2010 and 2020.
“The depth of losses in many of our rural counties, particularly our counties in the Sandhills and the northeast, was really significant,” Tippett said. “We had multiple counties that lost more than a fifth of their population.”
That shift has political consequences, especially when those concentrated populations all tend to vote one way.
“North Carolina voters have pretty much politically sorted themselves into discrete precincts,” said Michael Bitzer, professor of political science at Catawba College. “Whether they willingly did it or just by happenstance, these precincts have become more and more polarized. Less and less politically competitive.”
It’s not a new trend. And it’s not unique to North Carolina.
In his 2008 book, The Big Sort, journalist Bill Bishop examined the demographics of an American society that is growing increasingly polarized.
He and a colleague looked, among other things, at presidential election data from the mid-1970s on. They were especially interested in the changing number of landslide counties – solid Republican or Democratic areas where victors won by a margin of 20 points or more.
With that methodology, a county where Trump won 70% of the vote would be a landslide, compared to a competitive race where Trump edged out Biden 55 to 45%.
Cycle after cycle, fewer voters lived in competitive counties, Bishop found.
When you apply their analysis for North Carolina all the way to 2020, you find the same trend.
In 1976, 77% of the state’s voters lived in competitive counties.
By 2020, the number of voters in competitive areas dropped to 28% – the culmination of a nearly 50-year decline.
It’s a signal that the movement of people – not just district lines – is fundamentally changing our politics.
This “big sort” isn’t really a secret. It’s the cumulative result of a million different decisions about where we feel we belong.
We can see it in our neighborhoods. The signs staked in the yard and taped to apartment windows. The flags waving on the porch.
It can make gerrymandering harder to recognize. Are the districts really drawn unfairly? Or are we seeing the results of self-sorting? And can we solve one problem without addressing the other?
“We want a technical fix. And what we also really want is to blame ‘those people.’ And gerrymandering is good for both of those needs, human needs. And when really, the problem is us,” Bishop said.

What’s ‘fair’ depends on what’s normal
Six feet. Is that tall or short?
If you’re trying to draw a conclusion using a measurement – any measurement, really – you need something to compare it to.
In our case, we’d need to know the average height of men and women, which the CDC does. For men, it’s 5 feet, 9 inches. For women, it’s about 5 feet, 4 inches.
So 6 feet would be tall by comparison.
That’s just one dimension – height. For redistricting, we need multiple dimensions – or measurements – that can help us size up a plan.
That might include compactness – the measure of how irregular a shape is. Maybe how close a district is to a target population size so we comply with one person, one vote. We could check on the number of split counties, and even the partisan breakdown.
We can record those metrics for a single map proposal. But without something to compare it all to, there’s only so much those measurements can tell us.
So we need some way to establish what’s “normal” – the map equivalent of a quality sample of people’s heights like the CDC has.
If we do it right, this sample, or ensemble, takes into account all the natural weirdness of a state like North Carolina.
The shapes of our borders and coast, for example, muck with our compactness scores. Our population is concentrated in the state’s urban areas, naturally skewing us away from pure proportional representation.
A good ensemble of political maps would reflect all that.
“It automatically factors in the fact that Democrats live more in the big cities, that we have this weird wedge out to the corner, that we have a historical Democratic stronghold in the rural upper eastern corner of the state,” said Jonathan Mattingly, professor of mathematics at Duke University.
The work of Mattingly’s team was instrumental in convincing courts that the maps North Carolina Republicans drew during the last decade were extreme partisan gerrymanders.
They made their case by creating ensembles, thousands of maps that show what’s “normal” for North Carolina political districts. With a good ensemble, you can see how a map proposal compares – and whether it’s an outlier.
Mattingly’s team repeated their technique to evaluate maps Republican lawmakers approved in 2021, finding they all performed worse for Democrats than the ensemble under a variety of electoral conditions.
State Republicans expressed skepticism at the findings in early November, saying voting choices are “very complex and can’t be modeled by any computer.”
But similar mathematical techniques are already playing a role in court cases challenging North Carolina’s latest maps that are on a fast-track for trial this year.
Mattingly, whose team found similar partisan gerrymandering under Democratic control in states like Maryland, stresses that gerrymandering isn’t limited to Republicans in North Carolina.
“Both parties do this across the country, and so I would like us, as a country, to get out of the gerrymandering business nationally,” Mattingly said. “I would think that would be great for how we feel about our democracy.”
Want to dive deeper into political mapmaking and gerrymandering in North Carolina? Explore all four episodes of Monster: Math, maps and power in North Carolina, a special Under the Dome Under the Dome podcast produced by The News & Observer.
This story was originally published January 2, 2022 at 6:00 AM with the headline "Gerrymandered or no? How will courts judge new North Carolina political maps?."