How has your NC neighborhood grown since 2010? Use this map of census data to find out
READ MORE
North Carolina 2020 census data
Expand All
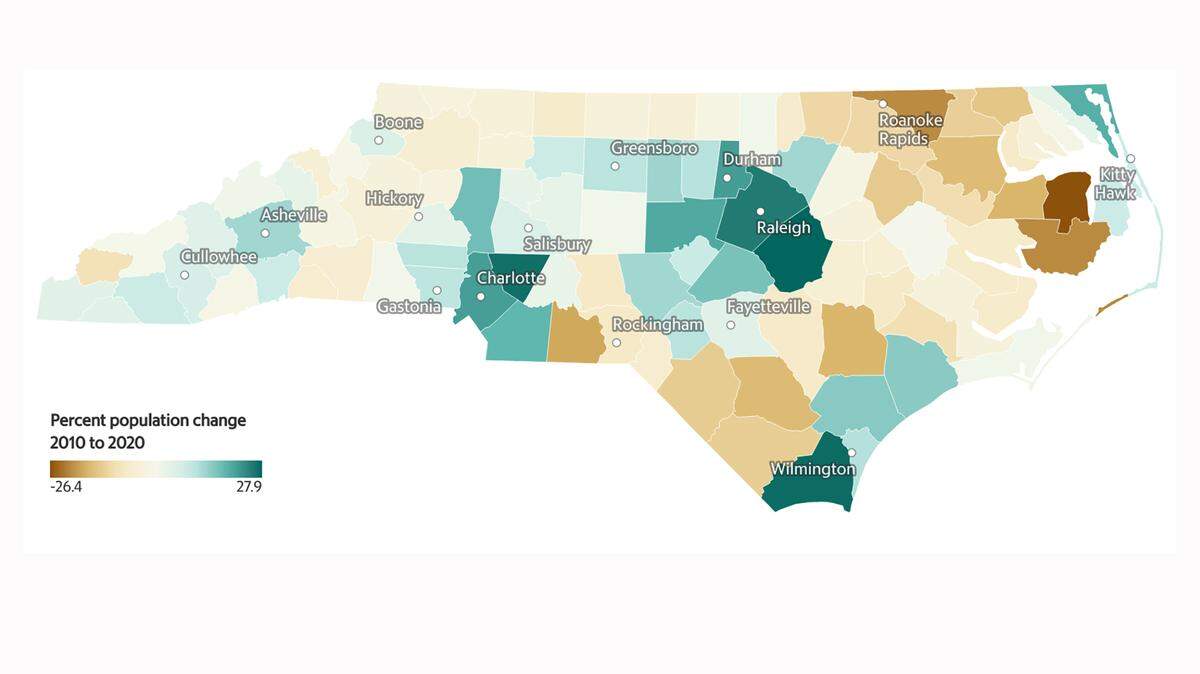
North Carolina’s growing population became more racially and ethnically diverse in the last 10 years as people flocked to the state’s major cities and suburbs.
That’s one of the big takeaways from Thursday’s release of a massive collection of 2020 decennial census data. It details population, demographics and housing statistics for every community in the country.
Although the top-level story in North Carolina is growth — enough to earn it an additional U.S. House seat — numbers get more complex on the neighborhood level.
We’ve created a way for you to see the demographic changes for yourself. Explore the map below to see how your neighborhood changed in population and diversity compared to the census count in 2010.
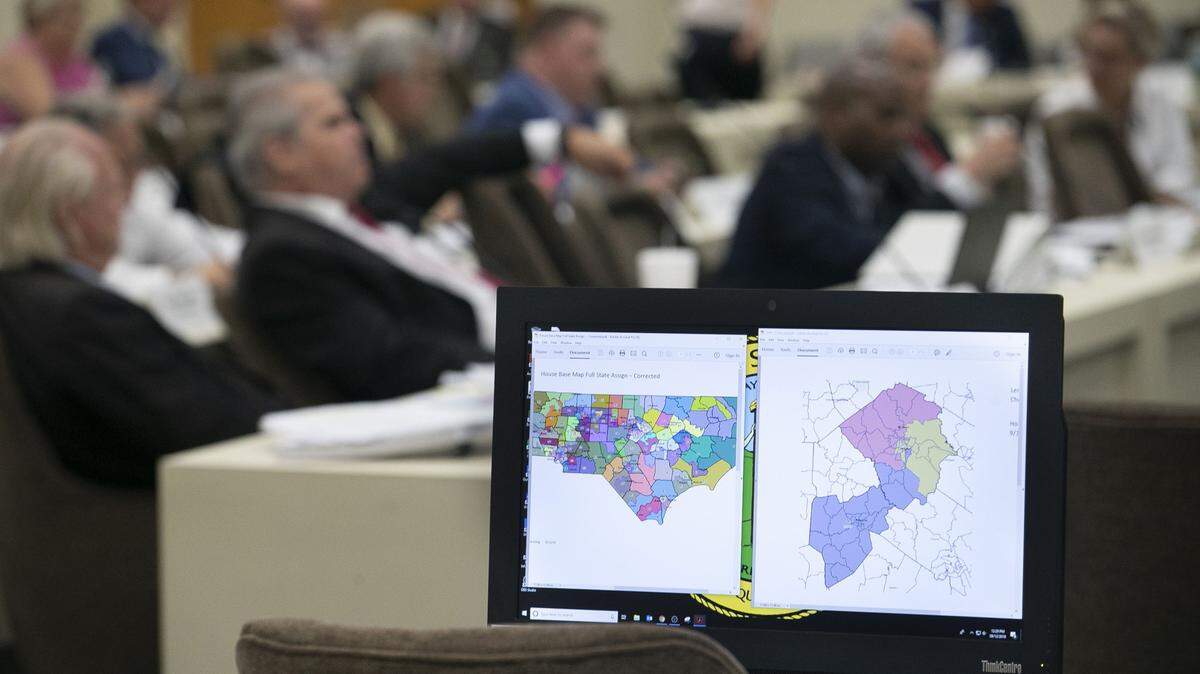
The new census data, needed to drive the once-a-decade process of redrawing congressional and state legislative lines, came months late following complications from the global COVID-19 pandemic and “processing anomalies” that required additional probing by the U.S. Census Bureau.
The data is far from perfect. Aside from coinciding with COVID-19 pandemic, the 2020 census count was subject to intense political and legal wrangling.
The Trump administration tried and failed to institute a citizenship question, which experts feared would discourage immigrant participation. The U.S. Supreme Court also allowed the constitutionally mandated count to end several weeks early, increasing concern about potential undercounting.
Still, U.S. Census Bureau leaders say they’re confident the 2020 data is “comparable with recent censuses” — and they released a set of quality metrics to prove it.
“We had numerous quality checks built into collecting the data, and we have conducted one of the most comprehensive reviews in recent census history during data processing,” Ron Jarmin, the bureau’s acting director, said in a statement back in April. “We are confident that today’s 2020 Census results meet our high data quality standards.”
This story was originally published August 12, 2021 at 2:05 PM with the headline "How has your NC neighborhood grown since 2010? Use this map of census data to find out."