From population to diversity, see for yourself how NC changed over 10 years

READ MORE
North Carolina 2020 census data
Expand All
Even at first glance, we learned lots about North Carolina from newly released 2020 census data.
The News & Observer and Charlotte Observer analyzed the updated population and demographic numbers to create searchable maps and tables. Use them to find out more about your city, county or town.
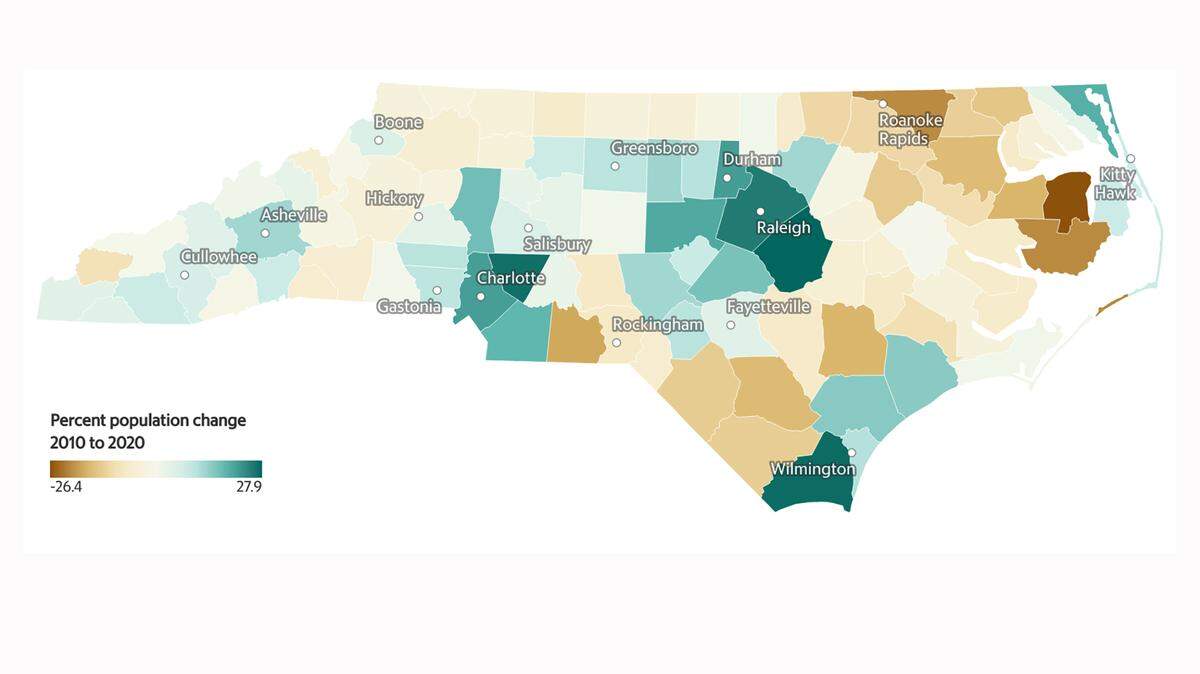
Population & district change
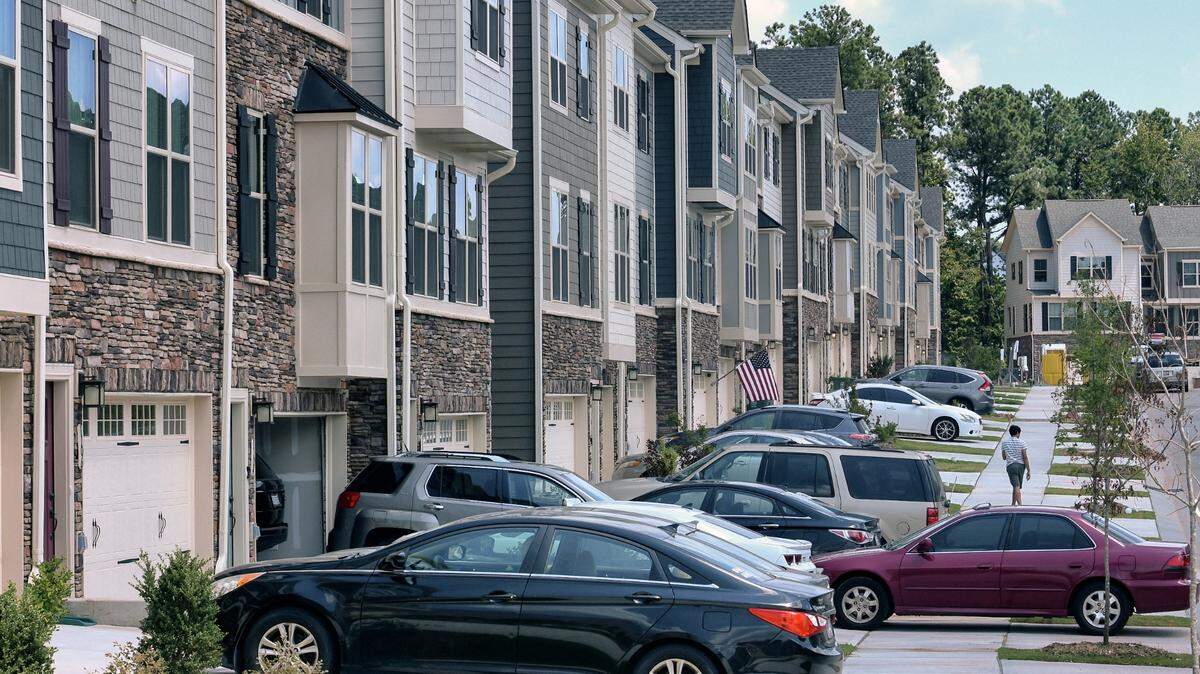
More than 78% of North Carolina’s population growth over the last decade occurred in its two largest metro areas, while more than half of the state’s 100 counties lost population.
We’ve known since May that North Carolina’s population grew 9.5% in the 10 years ending in April 2020, adding 903,905 residents, thus giving NC an extra representative in Congress.
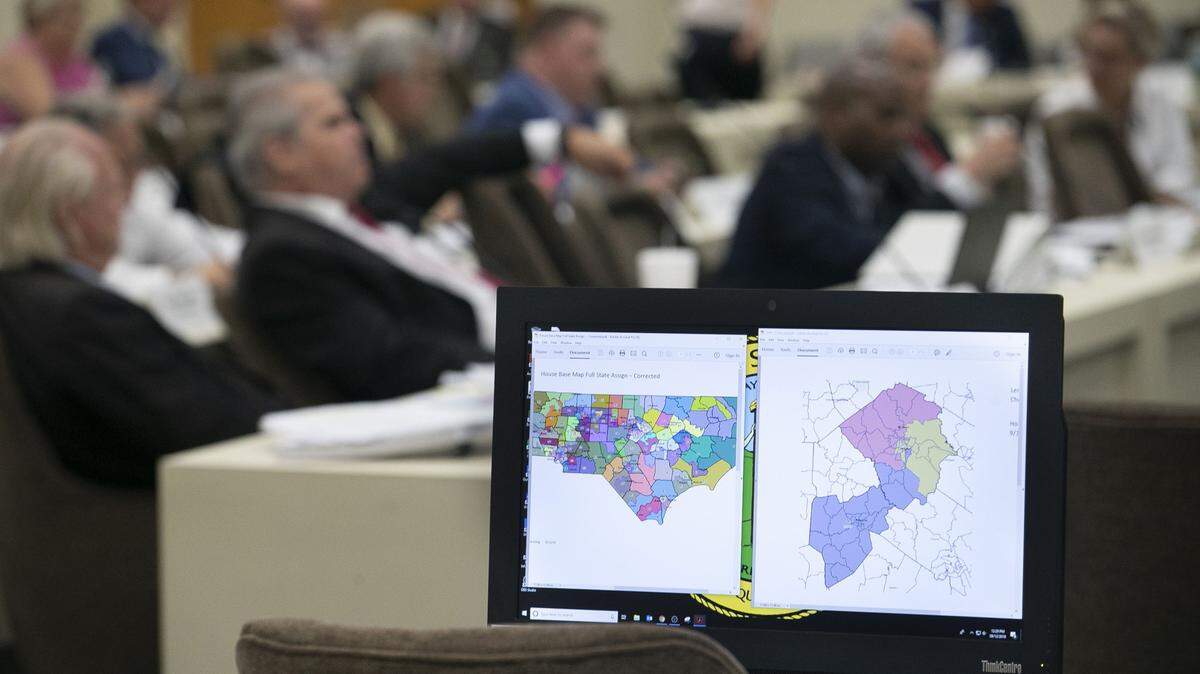
The actual count will help state legislators decide where to draw new U.S. House districts, which are obliged to include roughly the same number of people.
NC grows more diverse
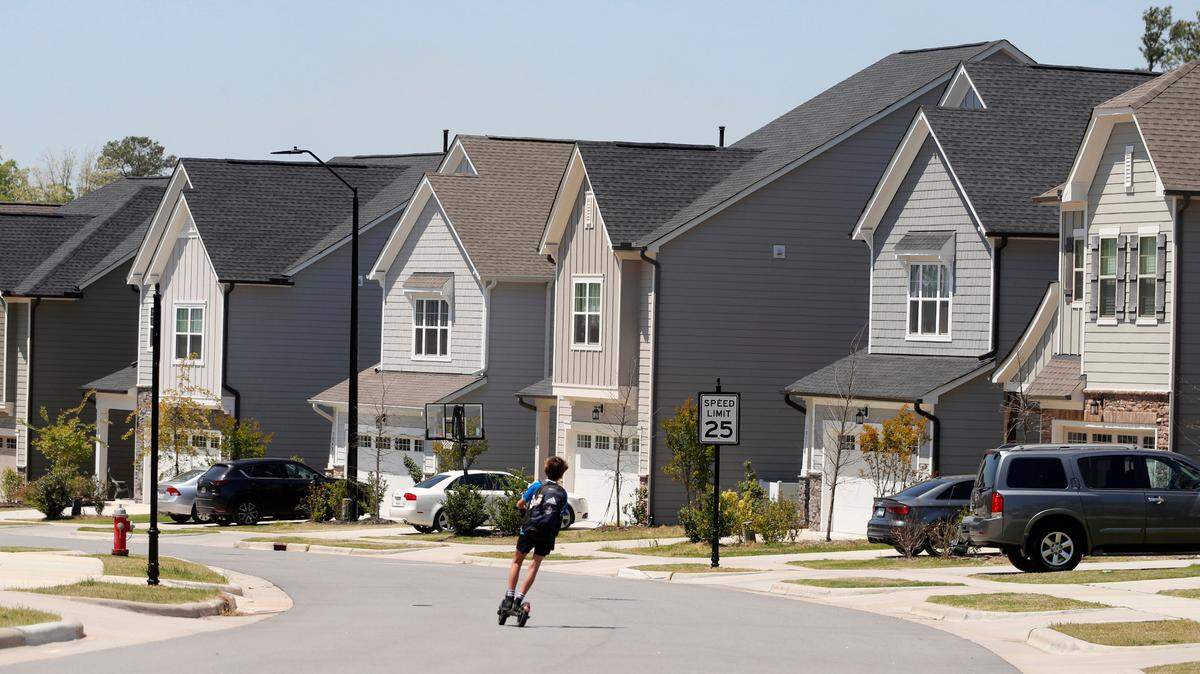
As more people moved to major cities and suburbs, North Carolina’s population became more racially and ethnically diverse since 2010. How much more? Take a look.
Triangle, Charlotte metro grow
The biggest bump in the latest count occurred in the Triangle’s six counties and the Charlotte metro area’s six counties. The state’s two biggest metro areas now account for nearly 39% of the state’s 10.4 million residents, up from 31% in 2000.
Search other towns, cities
It wasn’t only urban centers where populations numbers swelled, however. Some towns — mostly small in size and population — grew significantly, with a few more than tripling their population.
Want to get more granular about changes across North Carolina? Use the searchable table below to see how every town and city changed.
This story was originally published August 18, 2021 at 9:38 AM with the headline "From population to diversity, see for yourself how NC changed over 10 years."